Air Team
The Air Subteam is focusing on expanding the weather station network of the Finger Lakes Region by installing new weather stations as well as launching the tethered weather balloon built. We will be taking the data that we collect from the weather stations and balloon to model atmospheric boundary layers.
Air Team
The air team is responsible for tackling atmospheric physics and air quality data as well as improving weather balloon instrumentation and performance. We currently are undertaking two main projects: Finger Lakes forecasting via a tethersonde and studying atmospheric physics through boundary layer analysis through lenses such as extreme precipitation and temporal soil moisture.

Feeling the Winds
Air team splits its time between developing the tethersonde system and organizing a concerted effort to improve weather station and air quality networks in the Ithaca area.

Data Visualizations
-

Wind rose graph of seasonally averaged (Summer 2020) wind speed and direction for the NEWA weather station located in Lodi, NY. Wind speed (mph) is coded by color, length of wind rose indicates frequency of point value occurrence, and angle indicates wind direction.
-

Diurnal wind vector plots at NEWA weather stations located around Cayuga and Seneca Lake overlayed onto a colored contour map of regional topography. Vectors represent relative wind speed (indicated by magnitude of vector) and direction (angle of vector) averaged over Summer 2020.
-

Graph of temperature (˚ F) vs. time of day (hour #) averaged over the month of August 2021 at the Cornell Botanical Gardens. Overlayed vectors show relative wind speed (indicated by magnitude of vector; units in mph) and wind direction (indicated by vector angle) plotted at each hour of the day.
-
![]()
Air sub-team member, Chloe, designing the reel control circuitry casing using prototyping software.
-
![]()
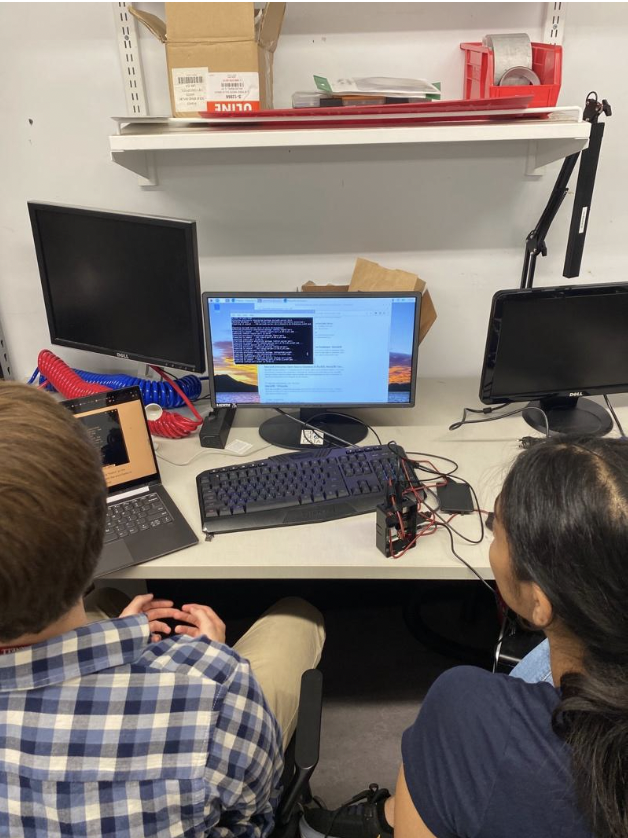
Members, Aastha and Roberto, writing computer programs which allow our RaspberryPi-based sensor to collect high-resolution atmospheric data.
-
![]()
Air subteam lead, Callum, operating the helium pressure regulator to inflate the balloon during the team’s first indoor tethersonde test launch.
-
![]()
Team member, Sam, assembling his second design iteration of the tethersonde’s safety reel control system.